Category Archives: Anaerobic Digestion

Anaerobic Digestion Process Metrics

Anaerobic digestion process metrics can be extremely important overall performance of the system. The efficiency can be measured in two different ways. Both of these focus on two different aspects of the process. These are:

  1. Biochemical process
  2. Physical process

Biochemical Process

Conversion Efficiency of The Inputs

Within the biochemical reaction that takes place throughout the process, we can use certain data to measure how our digester is performing.

Firstly, we can use the organic matter that we put into the system to measure the outputs from the process. If the biogas yield was required then we could use (m3/tOM). With m3 representing the biogas yield from the output of the digester and tOM being the tonnes of organic matter loaded into the digester.

If we wanted to find the electricity yield from the process we could use (kWhe/tOM). Where kWh is the electricity produced by the CHP unit in the system and tOM is the tonnes of organic matter being loaded into the digester.

Digester Productivity

Secondly, we can look at the productivity of the digester itself and how it is performing. To do this we would use (m3CH4/m3D day). Where m3CH4 would be the biogas that the digester is outputting and m3D day is the volume of digestate being produced per day from the process.

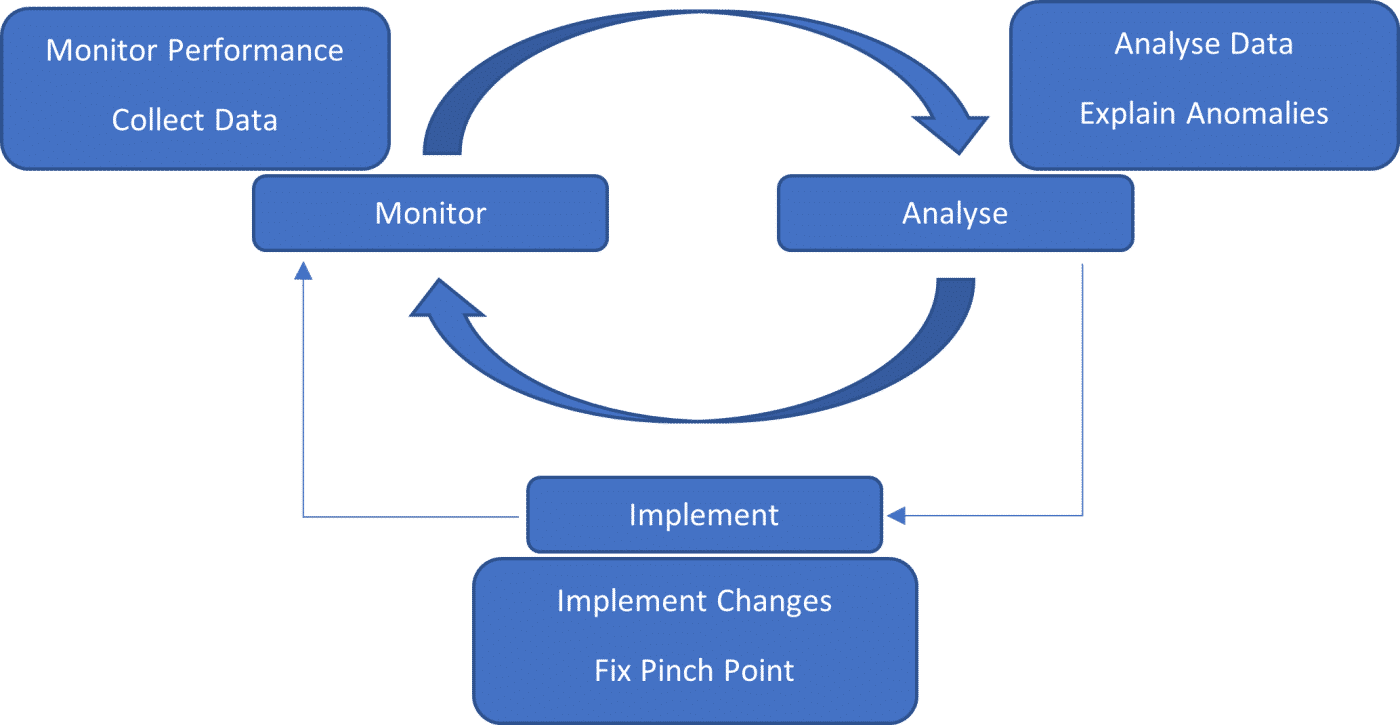
Focusing on both of these outputs from the process will give a clear understanding of how the digester is operating. From this, we can then compare this against benchmark data to see if it is underperforming.


Physical Process

Conversion Efficiency of The Outputs

When assessing the performance of the direct outputs we have to look at the physical processes that are taking place. In Anaerobic digestion process metrics, this is typically done by looking at the performance of the engine, typically known as the combined heat and power (CHP) unit.

This can be done through two methods. The first is the yield of electricity from the CHP unit. We can derive this from using the formula (kWe/m3CH4). Where kWe is the number of kilowatts of electricity that is being produced by the unit and m3CH4 is the amount of methane being produced by the digester per day.

The second method is total engine efficiency. This is the sum of electric output added to the sum of thermal output and divided by total fuel energy input (see below). From this equation, we would expect to see a value of around 60-80% efficiency from our CHP unit.

 ηo =    We + ∑ QTH  /  QFUEL


References –

Roots Organics Ltd

Methods for Calculating CHP Efficiency | US EPA

Need help with your feedstock processing?

Contact us to see how we can help

Contact Us

6 Important Factors Affecting Your Digester

There can be many different factors affecting your digester. It is the job of the operator to spot when things are not performing as they should and to react quickly to solve problems. These factors determine the rate and efficiency of the anaerobic digestion process.

6 Factors Affecting Your Digester

Type of Feedstock

The feedstock is critical in the process. Without it, there would be nothing to process. However, the feedstock can be one of the biggest causes of process inefficiencies. This is due to the nature of the feedstock, its biological make-up and how it acts. Feedstocks, such as manure, have high water contents with low biogas yields. This also means the organic loading rates are not as high as energy crops. These energy crops have a high yield, but their biology means it is easy to overload the digester.  

More on feedstock

Process Temperature

The temperature of the process can be equally as important for the process. As we know there are two main temperature ranges for the AD process: mesophilic and thermophilic. Each system will be designed with the temperature range at the forefront and constructed around this. Mesophilic temperature processes are commonly steady but stable. However, thermophilic temperature ranges allow the process to take place quicker, but it is more unstable.

More on process temperature

Presence of Toxic Materials

Toxic metals in the AD process can be a nuisance for any process operator. Heavy metals can cause damage to equipment and the system itself, which could mean costly downtime and maintenance. Once the heavy metals make it into the digester they can then start to cause havoc on the biological process. The metals react with the process differently from the normal feedstock.

The same is also true for other contaminants that enter the system. If the system ends up with high levels of ammonium, sulphates, sodium, calcium and potassium then the process can become just as unstable. This is where continuous system monitoring is essential to spot the problem before it becomes catastrophic.

pH & Alkalinity

As mentioned in previous articles, the pH of the process is an extremely important factor. This combined with the temperature can be a major factor in digester biology. It can good indicator for process health. However, it is not always the best way to use pH alone as it can sometimes not give us the full picture. That’s where FOS/TAC levels are best for measuring digester health. From this, we learn the alkalinity buffer of our system and what we need to add to the system to make it stable.

More on pH

Hydraulic Retention Time (HRT)

HRT is the average amount of time the medium stays inside the reactor for. It is usually expressed in hours or days. To work this out you simply divide the volume of the tank by the influent flow rate. E.g 100m3 digester tank with an influent flowrate of 50m3/hr = 100/50 = 2 days.

Rate of Digester Loading (OLR)

The organic loading rate refers to the feedstock contents and its VFA profile. When it comes to energy crops, fats oils and grease (FOG), or glycerol, these feedstocks have extremely high OLR rates, which means they have a high yield percentage, but due to their biological contents, they are volatile, meaning the process can become unstable much quicker. Feedstock materials such as cow manure have much lower OLR rates but because of their biological make-up, the process is much more stable. This means the biogas yield is less than a higher OLR feedstock.

How Are These Factors Affecting Your Digester?

These six factors come together in the process of anaerobic digestion to create robust biology within the digester. This robust biology means that when there is a slight imbalance with one aspect, then it does not harm the digester as a whole. Process efficiency is down to these fundamental aspects, which as we know, can be the difference between making money and losing it.


Reference – Roots Organics Ltd

Need help with your feedstock processing?

Contact us to see how we can help!

Contact Us

How to Effectively Measure Digester Health

FOS/TAC levels in the digester are an efficient way of assessing the health of the digester. This is because pH alone is not suitable to evaluate biological health. Although at first, FOS/TAC levels can seem quite confusing, they aren’t as complicated as they may seem.

What are they?

FOS/TAC = Fluchtige Organische Sauren/Total Anorganic Carbon

In more simple terms, FOS refers to the volatile organic acids within the digester. TAC refers to the alkaline buffer present. Most AD plants will have a machine that calculates this value automatically. However, there are manual ways of conducting this test.

Why are they important?

Buffering capacity is the amount that can be “soaked up” of the acid or base in the system as if it is a sponge. But, once this sponge becomes saturated, it can no longer soak anymore up. In our case, this is when the digester can start to become sub-optimal.

With a strong buffer in the digester, the pH will remain stable during acidification. This means that the biology will stay healthy and within the correct pH range. If the digester has a small or non-existent buffer when the digester goes through the acidification process, the pH will fall, and the biology will be unhealthy. Potentially leading to souring.

Is the FOS/TAC ratio the same for all systems?

There are many types of AD systems all of which have varying feedstocks. Typically, AD that uses manure as its primary feedstock tends to have a good buffering capacity. Whereas food waste AD processes will potentially need bicarbonate to provide alkalinity.

The ratio we get from calculating the FOS/TAC levels can then tell us how healthy our system is. If the level is higher, then the chance of acidification is also higher. The optimal level is between 0.3-0.4. However, each plant has its optimal ratio.

Advantages

  • Easy and fast to test
  • A useful parameter that tells us the state of the biology
  • Allows us to see problems before it’s too late

Disadvantages

  • Relies on accurate pH measurement
  • Absolute value depends on the preparation of samples

How to test the FOS/TAC levels

As mentioned previously the FOS/TAC levels can be measured with specialised equipment that will do all the work for you. However, using the Norman method, you can do it manually.

  • Take 20ml sample & add 180ml demineralised water
  • Agitate and connect to pH meter
  • Titrate with H2SO4 (0.05mol/l)
  • Note the volume of H2SO4 needed to reach pH 5 (V1)
  • Note the volume of H2SO4 needed to get from pH 5 to pH 4.4 (V2)

FOS = (V2x1.66-0.15) x 500

/

TAC = V1 x 250


References

Roots Organics

Biogas plant Monitoring • BiogasWorld

Need help with your feedstock processing?

Contact us to see how we can help

Contact Us

9 Ways to Know Your System’s Health

There are many indicators within a biogas system that can determine how well the system is operating. It can be an immediate response from the system or over a long period. Due to the process being made up of many variables it can often be difficult to locate the specific problem. However, from the response in the digester, we can then assess the actions needed.

Short Term

Biogas Quality

The immediate indicator from the digester will be the methane and hydrogen sulphide levels. In a normal digester, running efficiently, the methane levels will be expected to be around 75%, with carbon dioxide being a large proportion of the rest. If this percentage has dropped it may be cause for concern. Foaming and other process issues could be interfering with the production of quality biogas.

Biogas Volumes & Energy Yield

Much like the biogas quality, the volume will also be affected by inefficiency or a problem in the digester. This coincides with having benchmark data for your process. If there is a set standard of biogas you expect to see from the process per day and this is not being reached, then it requires further analysis. This then translates into the amount of energy yield. With the digester being inefficient and producing an inadequate amount of biogas, then the energy output from the system will be considerably less.

Medium Term

VFA’s, FOS/TAC & pH

Medium-term effects on the digester occur when particular levels in the process start to become abnormal. Telltale signs are the VFA (volatile fatty acid) profiles, the pH within the digester and the FOS/TAC levels.

(More on FOS/TAC)

Floating Layers & Foaming

Once the imbalance begins in the digester, it is followed by layers beginning to form on the surface of the digester. These can either be in the form of a ‘crust’ or foaming, depending on the imbalances. To counteract the layers forming, a good method of mixing is essential to keep the liquid moving. Also, clearing or breaking the layer can be useful to ensure the biogas can escape. Following this, it is essential to measure and monitor the levels in the system and compare them to the benchmark data.

(More on foaming)

Long Term

Digestate quality

The long-term indicator of a healthy system is the quality of the digestate. Once the digestate has been pumped out of the digester and de-watered, we can then assess its quality. These assessments are done primarily on the smell of the digestate, texture and also a visual inspection.

Need help with your feedstock processing?

Contact us to see how we can help

Contact Us

How to Keep Your Anaerobic Digestion Process Stable

The digester goes through multiple stages from start-up through to being stable. Each one of these is critical. If at any point the digester becomes too unstable, it can have serious consequences for the whole process. But, getting the Anaerobic digestion process to eventually become stable is a difficult and lengthy task.

Start-Up

At this stage, the process is extremely fragile. Because of the initial feed into the digester, there will be millions of different variations of biology present. If the feedstock is lignocellulosic, found in fibrous material, then it will be biologically different in comparison to acidic feedstock such as food waste.

Stable Operation

From the start-up to being a stable digester, this is called primary succession. Here the microbes inside the digester will have matured and become robust. Meaning they don’t become unbalanced as easily as in the startup phase. As the digester moves through the four stages of anaerobic digestion some species begin to dominate, becoming ever more acclimatised and balanced.

Unstable Operation

If the digester is overloaded or one variable in the process changes suddenly, then this can have a massive effect on the digester. Even a small change in pH can stress the digester and make the process unstable. See more on pH levels here – https://pipe-liner.com/2021/08/31/ph-its-all-about-balance/

Mature biology then becomes fragile, leading to further Anaerobic digestion process instability. If action is not taken on balancing the digester then it is at risk of souring. Meaning the digester would have to be emptied and the start-up phase would have to take place again. This would be costly and time-consuming.

If the digester becomes unstable but action is taken to stabilise the process, then the digester will slowly start to become healthy again. However, biology will be poor in variety and will be somewhat limited.

How to Avoid Process Instability

Many variables within the digester can affect the process such as feedstock contents, FOS/TAC, pH, temperature and many more. It’s a balancing act to keep the digester running at its best.

The first step to process stability is trying to keep the feedstock relatively similar in characteristics. Too many variations in the feedstock can allow the digester to become stressed and start to decline in performance.

The next precaution is that the digester is not being overloaded. Each digester will be able to handle a certain number of volatile solids per unit digester volume per day. If this is exceeded then it can lead to process issues such as foaming and potentially souring.

Process monitoring is an integral part of any AD process. To keep the process running as smoothly as it should be it is essential that all variables are being measured and analysed. From this adjustments to the process should be made to ensure it is running efficiently.


Reference – Roots Organics Ltd

Need help with your feedstock processing?

Contact us to see how we can help

Contact Us

WRAP Report Shows Rising Gate Fees

Gate fees are commonplace at larger AD facilities, with some smaller scale plants using gate fees too.

The purpose of gate fees is to offset costs of maintenance, labour, and capital costs of the system as a whole. If there is any residual costs e.g disposal of any remaining substrate, these are included in the gate fee too.

Annual fees have seen a rise in price for the second year in a row. A report produced by WRAP has shown that the median price of gate fees in the UK is around £35 per ton. Often, companies will have contracts in place to set these gate fees for a specified length of time. Many suppliers are reluctant to be tied into long term arrangements due to the competition for material and the ability to play the market. This means contracts are typically one year in length. Only one company in the WRAP survey said that they charge customers “on the door”

Why the rise?

This rise in gate fees is thought to be largely down to increase in operating costs and inflation.

As with most things, Covid-19 has had an effect in some way or another. Anaerobic Digestion is no different.

Because of Covid-19, the hospitality industry suffered massively as pubs, restaurants and many other venues couldn’t open. Therefore, they were not producing the waste that would end up at the processing sites.

So, to recover these costs, gate prices have gone up to try and weather the storm of the pandemic. Alternatively, people spent more time at home, producing more food waste. This has balanced the scales slightly, but not enough.

It is expected that gate fees will continue to rise marginally for the next few years, to try and recover from the pandemic.

However, in the long term, it is thought that AD facilities in close proximities will begin to compete much harder, in turn driving the prices down. With existing over capacity in some regions, we may start to see it being matched by the supply as a result of the waste strategy and the mandatory separation of food waste in England and Wales from 2023.

Technical report templates (wrap.org.uk)

Need help with your feedstock processing?

Contact us to see how we can help

Contact Us

Three Areas to Optimise Your Anaerobic Digestion Process

Learning how to optimise your Anaerobic digestion process is how the plant becomes more efficient in small increments. As we know, the process of AD has to be running at optimal levels to be profitable. Therefore, optimisation means profitability. It can be hard to know what to optimise or how to go about doing it. In this article, we will uncover three main areas of your process that you can implement changes to.

How to Optimise Your Process

The Process

Firstly, we can look to optimise your anaerobic digestion process by looking at how the process is run. If the technology provider has created a specific program to enable the process to run at its best, but the operator has decided to put the process in manual or override a particular part of the process, then it will be running sub-optimally.

The technology provider has designed the program to reduce variability and ensure the process remains as stable as possible. Of course, it is justified if one part of the process has failed and is causing severe inefficiency in the rest of the system. Therefore, it would be ideal for the operator to use the manual mode to implement a temporary solution whilst the failure is rectified. Once we have ensured that our process is running the dedicated program, then we can move on to looking at other aspects of the process.

The Equipment

The second element we can consider optimising is our equipment. The equipment is an important aspect – without the hardware, the process quite literally wouldn’t run. This can be anything from pumps to macerators and mixers.

To optimise the performance of our equipment, we first have to monitor it over a period of time. Typical monitoring can consist of monitoring hours run, amps being drawn, frequency of operation and output/throughput that is achieved. Once this data has been collected, we can then assess for potential opportunities.

Control Loops

The last of the optimisations is the control sequences. There are hundreds of control loops within the program on an AD system. These control loops each have their duty to monitor a particular aspect of the process. For example, these can be the temperature in the digester, the level in the tank or even the flow throughout the process. If one of these control loops isn’t operating correctly or is too slow to react, it can start to cause inefficiencies in the process, which then will have a knock-on effect.

Much like the equipment optimisations, it is best to monitor the data and compare this against the benchmarks. If the data for a particular control loop is producing an anomaly, then it can be spotted quickly and dealt with.

Getting the metrics correct within an AD system is particularly important as any slight change in temperature or pH can be the difference between profits and losses. If the digester sours at any point, then it is a long and costly process to empty, refill and restart the system over again.


More on process optimisation –

https://pipe-liner.com/2021/10/18/how-to-optimise-your-process/

https://pipe-liner.com/2021/10/25/the-process-optimisation-timeline/

Need help with your feedstock processing?

Contact us to see how we can help

Contact Us

Anaerobic Digestion Process Optimisation Timeline

The process optimisation timeline can be tedious, with small changes over a lengthy period of time, to ensure process stability is maintained. It is no surprise that when a new plant is installed, this is no different. There are two main roles in a new digester start up that are key. These are the technology provider and the operator of the equipment.

Process Design

At this stage, there will often be a greenfield site with the opportunity for a biogas facility. After all necessary planning applications and permits have been granted then the technology provider can start designing the process. This is not a one size fits all process, as each site will have many variables such as, feedstock, outputs, physical space, access and egress, and limitations due to permits.

More on Process Design

Start Up/Commissioning

Once the design has been created, and the installation has taken place, the plant can then be started up and commissioned. The operator will be trained on how the process should run and what to do if it is not acting how it should. It is the technology providers duty to ensure the system is properly tested and all control systems are functioning correctly.

Early-Stage Operation

At this stage the technology provider has commissioned the system and provided training. It is now the job of the operator to monitor the system and make any adjustments they see necessary. This phase is about keeping the process stable, whilst keeping alterations to a minimum, to set data and performance benchmarks. Once these benchmarks have been set, this can then be fed back for analysis to implement changes that need to be made. It is at this point where the process optimisation timeline begins.

Mid Stage Operation

Now that the benchmark data has been accumulated, it can then be assessed for areas of improvement. At this stage the operators can start to detect anomalies within the process and put an action plan in place to overcome this. Once optimisations have been made, then the process is continuously monitored to determine a new set of benchmark data.

Later Stage Operation

Once optimisations have been made and the process has started to mature, the emphasis can now be put on planning to maintain the performance of the digester. Whilst this is going on, plans should also be in place for unexpected circumstances within the digester, or any part of the process. This is to keep any downtime or potential inefficiencies of the process to a minimum.


Reference – ROOTS Organics Ltd

How to Optimise Your Process

What is Process Optimisation?

In any industry, professionals seek to optimise the way they do things, in search of achieving more. This is a measured process, which can be defined by a particular increase in a given metric, via a feedback loop. Anaerobic digestion is absolutely no different. In fact, the whole process of anaerobic digestion relies on process optimisation, as it is driven by the output of the process being as maximised as it can possibly be.

How to Optimise Your Process

It is possible to optimise your process through small, yet systematic adjustments to the process to make the most effective use of the parameters, whilst ensuring process critical constraints are adhered to.

First, the key objectives must be identified. Often these are to minimise cost and increase throughput in the system. They can also be to increase the overall efficiency of the digester. Once this has been done, the pinch points in the system can then be determined, and a necessary action plan can be made to ease that particular pinch point.

The aim at this stage is to focus on one key specification, whilst keeping the rest of the process within the constraints. Process optimisation is largely done through trial and error. Once the process has started to return a better output, another inefficiency can be addressed. Due to the small, yet systematic changes, if the change has a negative effect on the digester it is much easier to reverse than making a large change all at once.

More on Process Optimisation


Reference – Roots Organics Ltd

Biogas’ Biggest Enemy

Foaming can be a common occurrence in the AD process. Although it happens regularly, this is not necessarily a good thing. Foam can prohibit biogas yield due to its structure, meaning it can be detrimental to the process. It can be the difference between making or losing money from an Anaerobic Digestion system.

What is Foaming?

The foam is formed on top of the slurry, inside of the digester. It is often dark brown in colour and can be extremely potent in smell. In some cases, the foam itself can comprise of up to 95% gas (Methane and Carbon Dioxide). There are many permutations of why the foam can occur, and it largely depends on the particular process itself.

Why does Foaming occur?

In a fully functioning system, as the bacteria deteriorates and eats at the feedstock, it goes through the four stages of AD. Gas bubbles form and then collapse, allowing the gas to escape and be given off. This is where the biogas is then stored at the top of the digester, ready for extraction.

Foaming can occur when the bubbles collapse slower than the gas is trying to escape, or the bubbles form a skin due to the surfactants not allowing the bubble to collapse.

There a many other ideas as to variable that can causing foaming. These include:

  • High organic loading rates (OLR)
  • Poor/insufficient mixing systems
  • Unstable pH
  • Temperature fluctuations

Consequences

In extreme cases it can block the pressure relief valve and the outlet, meaning that ultimately it could blow the roof off of the digester. Although, this is a rare occurrence. More common side effects are poor biogas yields and damaged process equipment e.g. pumps and valves.

What can be done?

The solids loading variation should be kept to a minimum as best as possible. Ideally, there should be not much more than a 5-10% variation in the OLR of the feedstock. To keep the process running at optimal levels it should be fed continuously, especially if it is fats, oils and grease (FOG), food and high-strength organic wastes.

Inside the digester, the mixing system should be suitable for the digester, ensuring that the mixing should not be too fast. Opposing that, the mixing should not be too slow, either. Ensuring that the mixer is not creating dead zones inside the digester.

At the design stage of the system, the digester should be correctly specified with additional headspace and overflow capacity, to allow for any foaming inside the digester, ensuring that it can be dealt with effectively before damage to the process equipment occurs.

More on Process Instability & Foaming